A confidence interval gives an estimated range of values which is likely to include an unknown population parameter, the estimated range being calculated from a given set of sample data, as this site puts it. This site says statisticians use a confidence interval to describe the amount of uncertainty associated with a sample estimate of a population parameter. They are used to predict the proportion of a population with a certain characteristic says this site.
Before we create a confidence interval for a single proportion and claim it to be true, for the interval to be valid, we must check some conditions: First, is our sample a random sample of the population? This must be true for our interval to truly represent the entire population. Second, is the sample size under 10% of the entire population? It must be independent of other events. Thirdly, and lastly, are there at least 10 successes and 10 failures in the sample? Only then can we have an unbiased sample.
Now that we have met our conditions, it is now time to calculate the interval. Before getting into the equations, we basically have our 

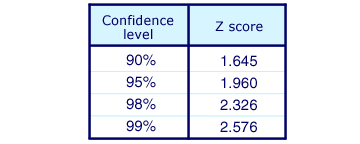
Finally, the last step is the conclusion. Depending on your confidence level you have chosen, you are that percentage sure that the interval you have calculated captures the true population proportion.
Summary of the three steps:
1. Check Conditions
- Is this a random sample?
- Is the sample population n less than or equal to 10% of the entire population N?
- Is
?
- Is
?

2. Calculate
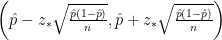
The 
You get your 
3. Conclusion
Fill in the blanks for your specific proportion interval: We are _____% confident that the interval (___,___) captures the true ____.
Make sure that your interval is in percentages in the conclusion because when you are talking to people, percentages make more sense than decimal numbers.
For the steps, this site is useful with more explanations as is this one for calculating which also needs something like this or just the chart above.

[…] Confidence interval for a single proportion (statsmethods.wordpress.com) […]